Golf Match Simulator App
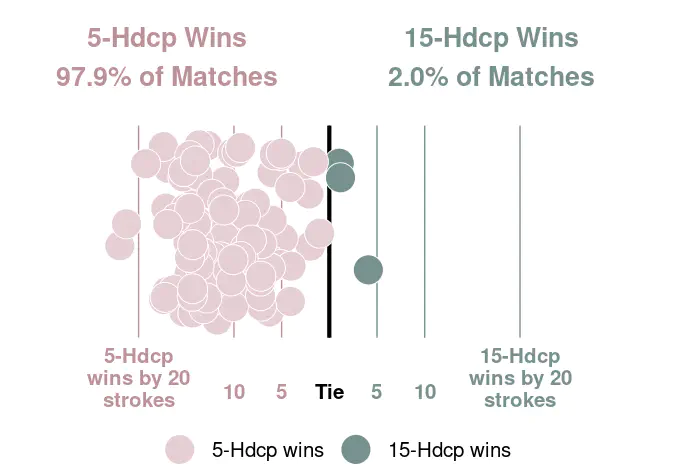 Example match prediction
Overview
What are the chances that a low-skilled golfer could beat an elite player in a single match? I built an R Shiny app to answer that question and compute any other hypothetical matchup. For more on the origins of the app, see this GOLF.com article I wrote.
This app provides a tool for users to run simulated matchups between golfers of different handicap levels, using either gross or net scoring. These simulations are based on real scoring data taken from a large sample of entries in the United States Golf Association’s (USGA) GHIN system.
Data
The data used in simulations come from a sample of about 2 million rounds from 100,000 golfers entered into the USGA GHIN system. The sample is restricted to golfers who have an established handicap index (HI) and have entered at least 20 18-hole rounds.
Methodology
A simple simulation procedure is used to predict outcomes for a given matchup. I will use the default handicap levels—5 and 15—to illustrate:
-
A score is sampled with replacement from the sample of 5 handicaps and the sample of 15 handicaps. These scores represent the results of the first simulated “round”.
-
The player with the lowest score for that round wins.
-
Steps 1 and 2 are repeated 10,000 times, resulting in a sample of 10,000 simulated rounds.
-
Win probabilities are determined for each player by taking the proportion of matches in which they win out of the 10,000 rounds.
Scores
Because of differences in course difficulty, par level, and playing conditions, any two given scores between golfers are not directly comparable. For example, a 75 on a relatively easy Par-70 course is not the same as a 75 shot from the tips at the Ocean Course at Kiawah Island. To accommodate for this, I use a normalized version of scores, which are based on a given score’s Handicap Differential: 72 + Handicap Differential. This normalized score can be interpreted as the expected score on a par-72 course, with a 72.0 Course Rating and a 113 Slope. Any scores presented in simulation results will be normalized.
Gross vs. Net scoring
If Net scoring is selected, players’ normalized scores are adjusted by their given handicap level. For example, if a 10 Hdcp’s normalized score is an 85, their net score would be 75 (85-10).
Handicaps
Handicaps are rounded to their nearest whole number value. For instance, 5.4 Hdcp would be considered a 5 Hdcp. While handicap indices range from +7 to 54 in the sample, the simulator tool restricts possible matchup choices to more common values in order to avoid simulation results based on only a few golfers in the sample. For instance, there are only a handful of +7 Hdcs in the sample; if a +7 is included in a matchup, their results would be based on a scoring distribution made up of scores from only, say, 3 golfers. Because a scoring distribution generated from so few golfers is not likely representative of players at that handicap level, I omit low frequency HIs (such as +7s) as an option in simulations.
Sean Bock
Research Scientist | Demography and Survey Science
I am interested in Quantitative Research, Natural Language Processing, Survey Research, and Data Visualization